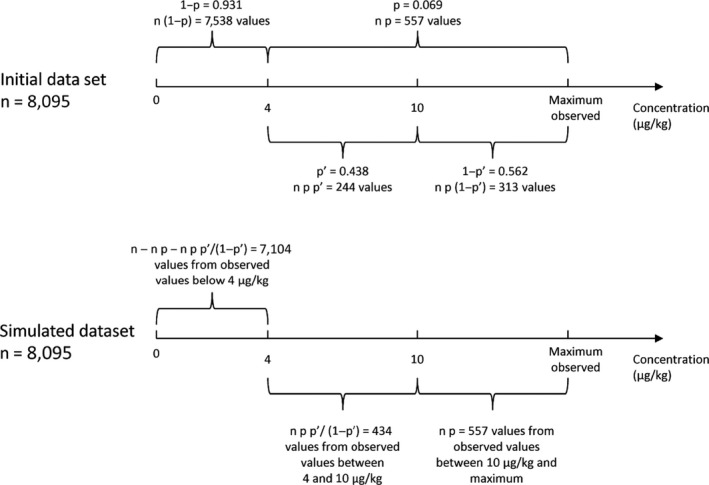
Figure 6.

Illustration of the methodology to simulate the data set on the occurrence of aflatoxins after the increase of the maximum level
- n = number of samples; p = probability of non‐compliance with the maximum level; p’ = probability of a concentration between 4 and 10 μg/kg when non‐compliant with the current maximum level.
