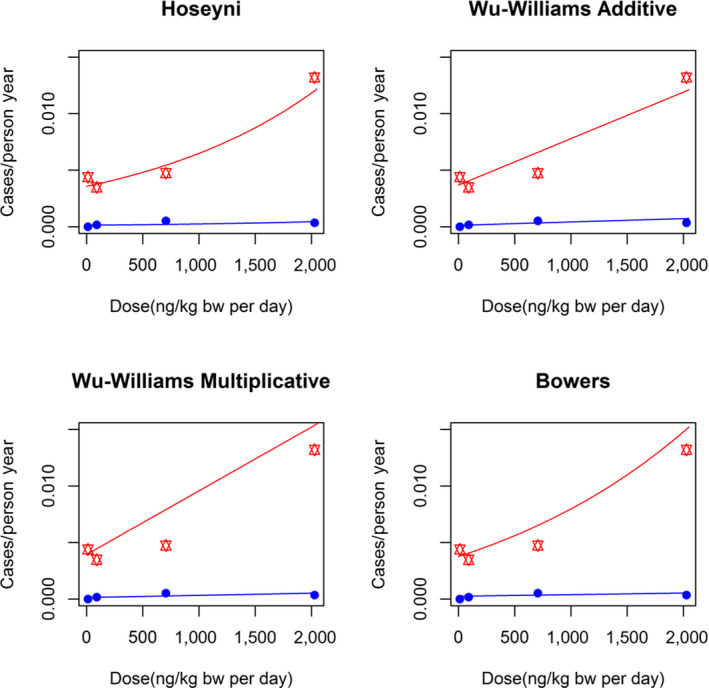
Figure B.1.

Dose–response models fitted by JECFA to the data of Yeh et al. (1989)
- Curves show the number of primary hepatocellular carcinoma cases per person years in function of the dose (ng/kg bw per day) for HBsAg positive (red) and HBsAg negative (blue) cases (see Section 1.3.1 and FAO/WHO, 2017 for further details).
