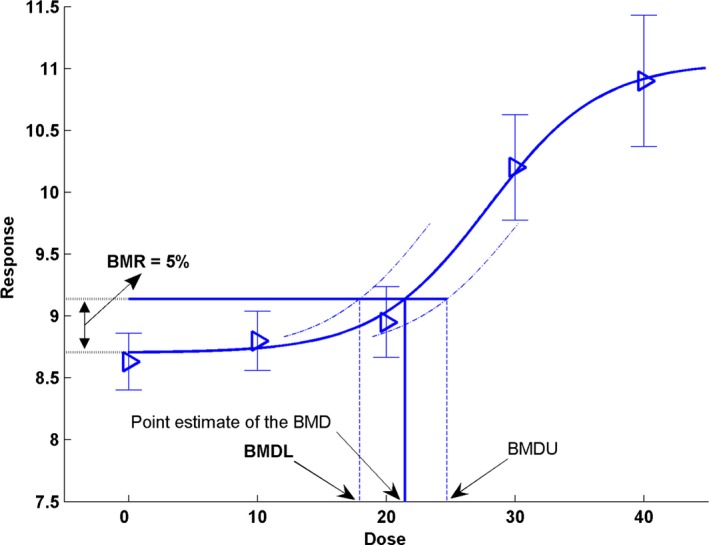
The observed mean responses (triangles) are plotted, together with their confidence intervals. The solid curve is a fitted dose–response model. This curve determines the point estimate of the BMD, which is generally defined as a dose that corresponds to a low but measurable change in response, denoted the benchmark response (BMR). The dashed curves represent, respectively, the upper and lower 95% confidence bounds (one sided)
4 for the effect size as a function of dose. Their intersections with the horizontal line are at the lower and upper bounds of the BMD, denoted BMDL and BMDU, respectively. It should be noted that the BMR is not defined as a change with regard to the observed mean background response, but with regard to the background response predicted by the fitted model. This distinction is important because, in general, the fitted curve does not hit the observed background response exactly (so that adding the BMR to the observed background response will in general not provide the correct intersection with the dose–response at the BMD). In the Figure, the BMD corresponds to a 5% change in response relative to background (BMR = 5%). The fitted curve yields an estimated background response of 8.7, and a 5% increase of that equals 9.14 (= 8.7 + 0.05 × 8.7). Thus, the BMD
05 of 21.50 is obtained from the intersection of the horizontal line, at a response of 9.14, with the fitted dose–response model. In this example, the BMDL
05 has a value of 18

