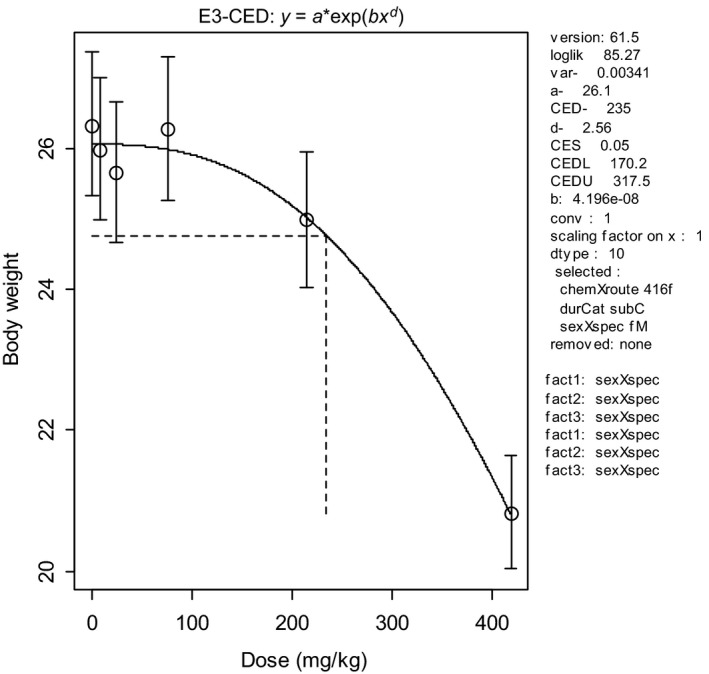
Figure 2.

Body weights in 10 individual animals per dose plotted against dose in mg/kg body weight (bw) (data from NTP study 416). Circles represent (geometric) group means, with 90% confidence intervals. The solid curve is the fitted dose–response model using PROAST v. 61.5. The dashed lines indicate the BMD at a BMR of 5%. CED = BMD, CEDL = BMDL, CEDU = BMDU
