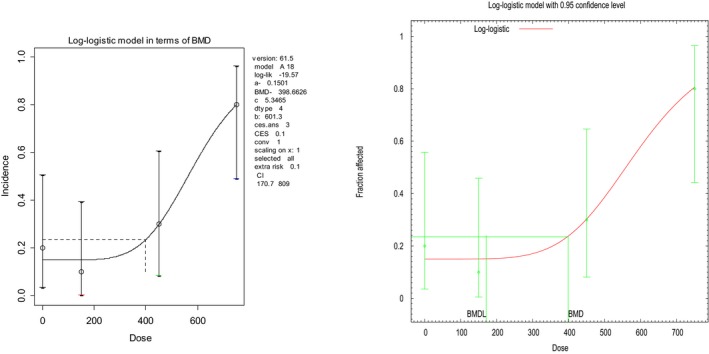
Figure 3.

Analysis of quantal data as obtained by PROAST and BMDS software. Fraction of affected animals in a toxicity study with 10 animals in each dose group (endpoint investigated: gastric impaction). A dose–response model has been fitted to the data (solid curve) and the horizontal line indicates the BMR of 10% extra risk compared to the response at zero dose (according to the curve). Log‐logistic model was fitted by PROAST (v. 61.5) and BMDS (v. 2.6) (see Table 3); the figures presented reflect the way in which the software generates the graphs
