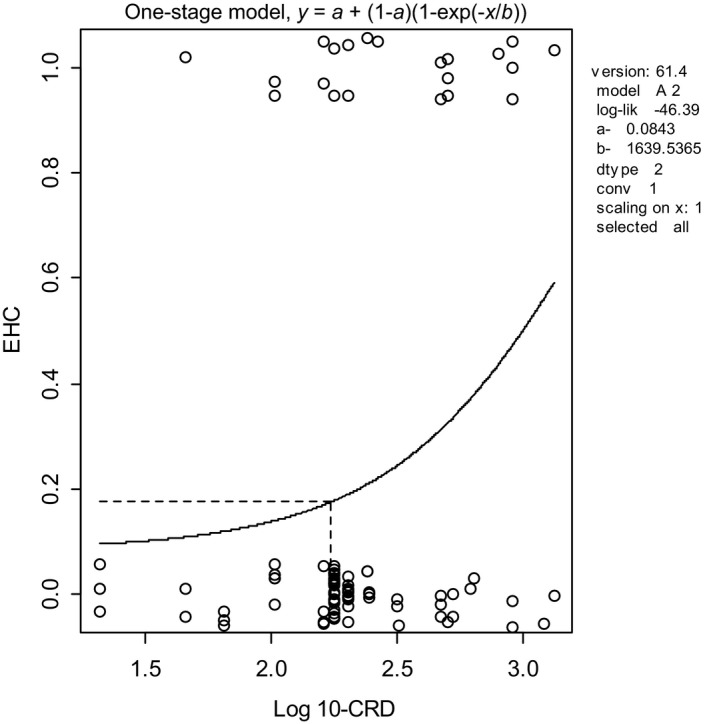
Figure 4.

BMD analysis of human dose–response data with individual exposures. Observed eye–hand coordination scores (0.0 = normal, 1.0 = abnormal) in individual workers (plotted as circles with some artificial vertical scatter to make the ties visible for individuals having the same exposure) as a function of exposure (CRD). A dose–response model has been fitted to these data using PROAST v. 61.4; the BMD 10 (see dashed lines) was 173, and the BMDL 10 was 92. A BMR of 10% extra risk was used
