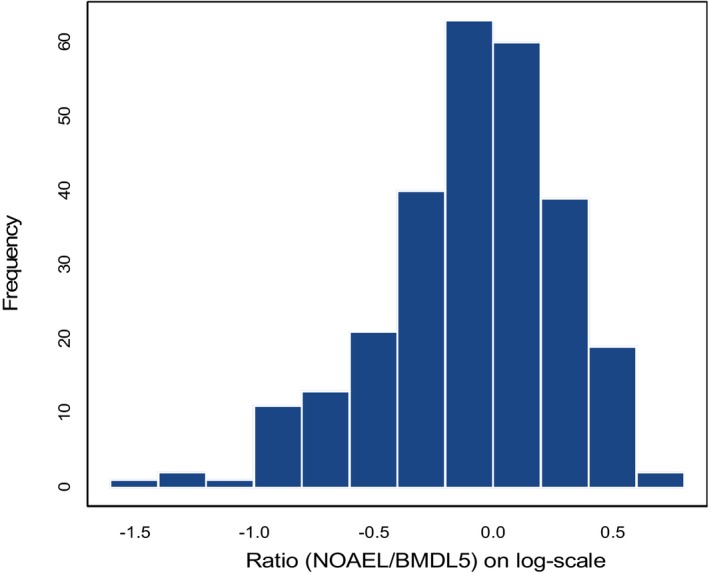
Figure 5.

Histogram of 395 NOAEL/BMDL 05 ratios (log10 scale) for the same dose–response data in rat and mouse (NTP) studies (Bokkers and Slob, 2007). The BMDL 05 relates to a BMR of 5%. Six endpoints were considered: bw, relative and absolute liver and kidney weight, red blood cell counts. The geometric mean of the ratios is close to 1, i.e. on average the NOAEL is similar to the BMDL 05
