Figure 6.

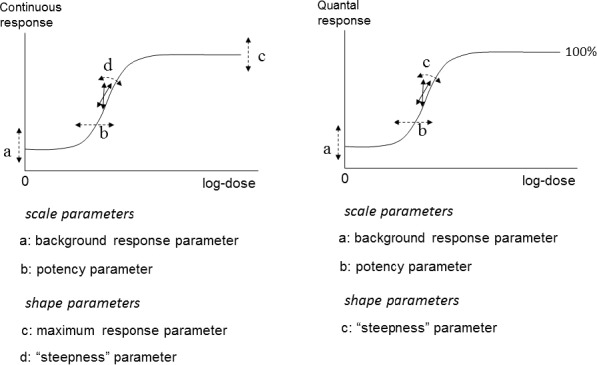
The four model parameters a, b, c and d and their interpretation for continuous and quantal data. The dashed arrows indicate how the curve would change when changing the respective parameter

The four model parameters a, b, c and d and their interpretation for continuous and quantal data. The dashed arrows indicate how the curve would change when changing the respective parameter