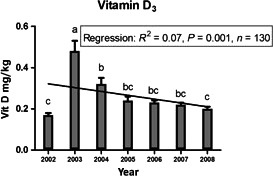
Figure B.1.

Available data on vitamin D in commercial Norwegian fish feed in the period 2002–2008. All data are given as mg/kg, represented by mean ± standard error. The line shows the linear regression analysis and the letters above the bars that do not share the same letters are significantly different (p < 0.05) (Reprinted from Sissener et al., 2012. Copyright John Wiley and Sons)
