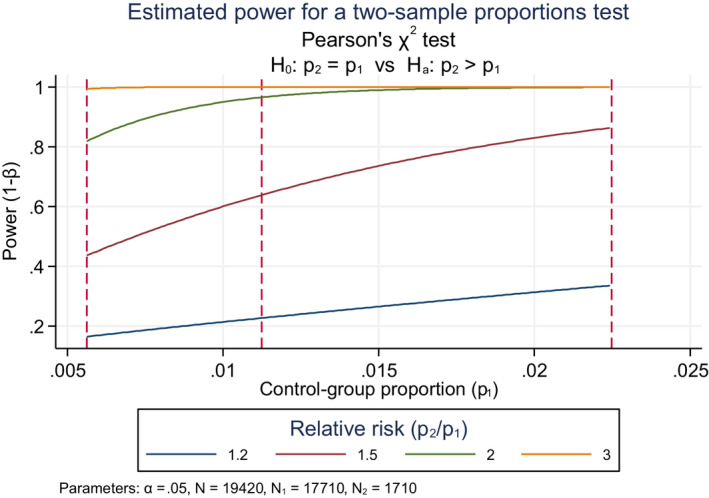
Graph showing estimated power for a (one‐sided) two‐sample proportions test evaluating power as a function of control‐group proportion at true RRs of 1.2‐, 1.5‐, 2.0‐ and 3.0. Dashed red vertical lines represent control group proportions at 1/2x of that observed, 1x of that observed and 2x of that observed and illustrate sensitivity of the power to these background rate assumptions.
