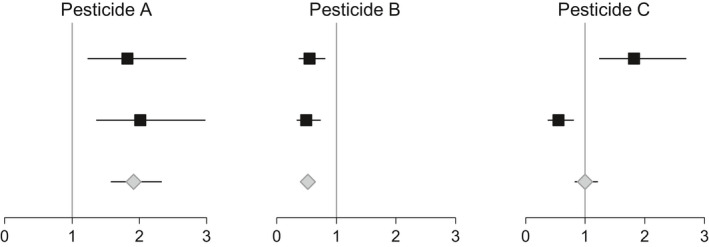
Figure 1.

Forest plots from a fictitious example in which each of three pesticides (A, B and C) is evaluated in a meta‐analysis of two studies. The x‐axis in each plot represents the estimated risk ratio of the disease of interest comparing exposed and unexposed individuals. The squares denote the estimated risk ratio in each study and the grey diamonds the summarised risk ratio. The horizontal lines indicate 95% confidence intervals
