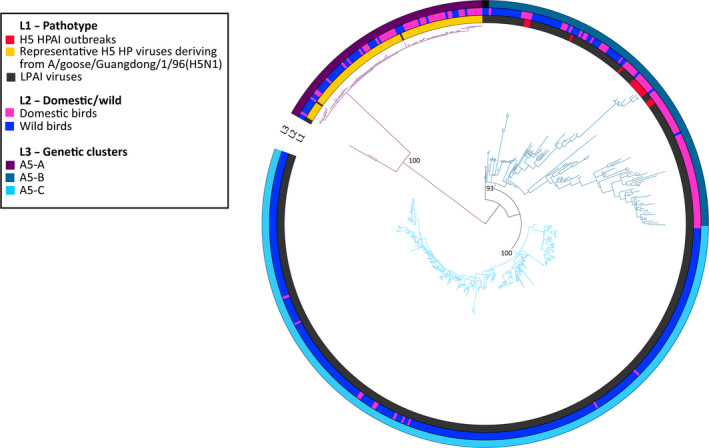
Figure H.2.

Phylogenetic tree constructed by Bayesian analysis of the H5 haemagglutinin gene segment of avian influenza viruses A collected in the Americas. Posterior probability values (expressed as a percentage) of the main clusters identified are indicated above the nodes (iTOL, 2016)
