
Figure 10.
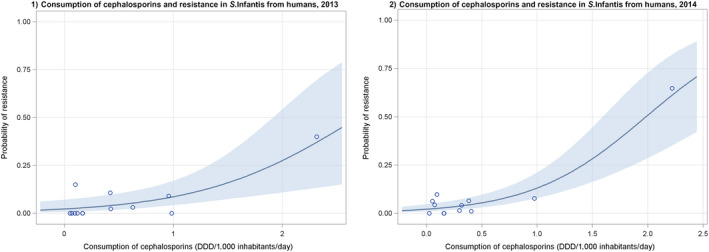
Logistic regression analysis curves of the total (community and hospital) consumption of 3rd‐ and 4th‐generation cephalosporins in humans, expressed in DDD per 1,000 inhabitants, and per day and the probability of resistance to 3rd‐generation cephalosporins in S. Infantis isolates from humans, EU/EEA, (1) 2013 and (2) 2014 (see also Table 8)
- Dots represent countries included in the analysis.