
Figure 32.
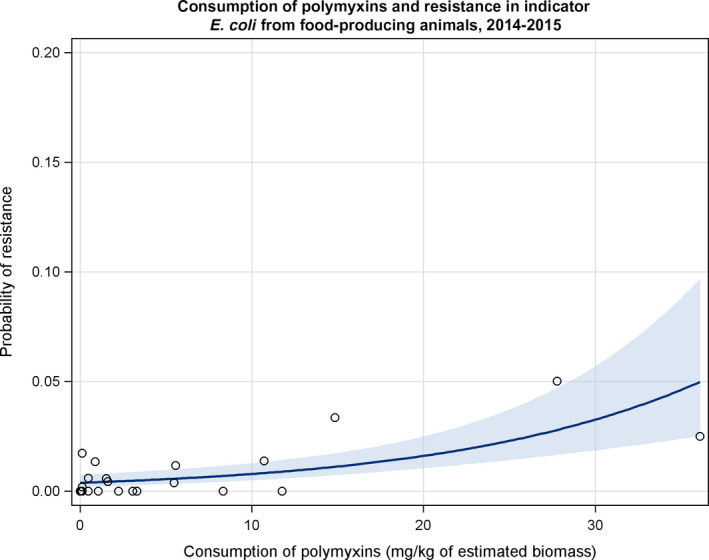
Logistic regression analysis curves of the consumption of polymyxins in food‐producing animals and the probability of resistance to colistin in indicator E. coli from food‐producing animals for 2014–2015 (see also Table 24)
-
Dots represent the countries involved in the analysis. The category ‘food‐producing animals’ include broilers, turkeys, pigs and calves for 2014–2015.The scale used in the graph is adapted according to the range of probabilities of resistance observed, in order to best show the distribution of data points.