
Figure F.3.
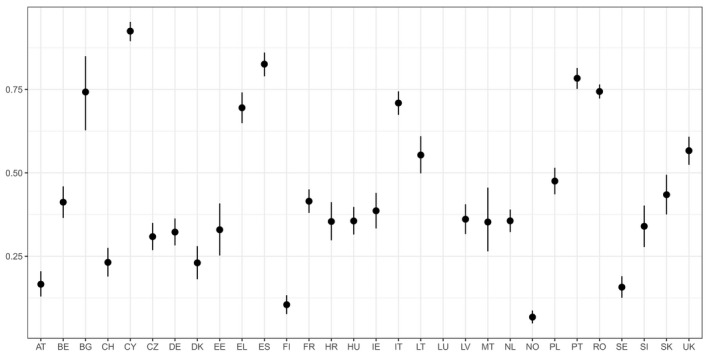
Results of the calculation of indicator ‘multi‐resistant indicator E. coli’ (indicator for AMR in food‐producing animals), as computed with the R code reported in Section F.5
Official websites use .gov
A
.gov website belongs to an official
government organization in the United States.
Secure .gov websites use HTTPS
A lock (
) or https:// means you've safely
connected to the .gov website. Share sensitive
information only on official, secure websites.
Results of the calculation of indicator ‘multi‐resistant indicator E. coli’ (indicator for AMR in food‐producing animals), as computed with the R code reported in Section F.5