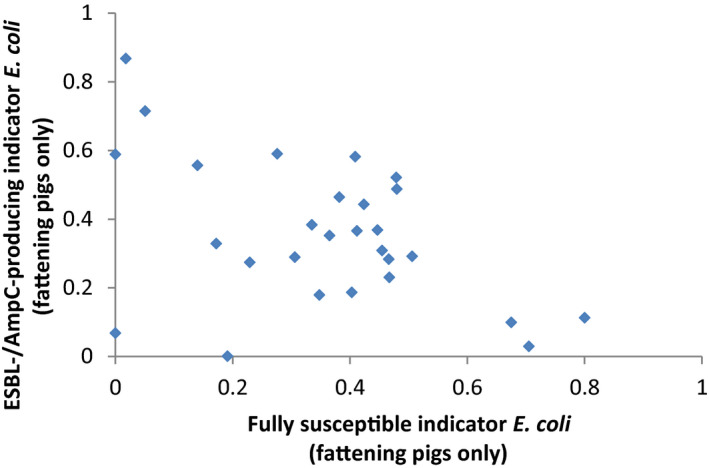
Figure F.7.

Correlation between possible indicators for AMR in food‐producing animals: selected indicator ‘fully susceptible indicator E. coli’ vs selected indicator ‘ESBL‐/AmpC‐producing indicator E. coli’
- The indicators have been calculated using the available data presented in the EUSR‐AMR reports for year 2015 (EFSA and ECDC, 2017). For the purpose of this graph, mean values of the indicators are considered. Since the indicator on ESBL‐/AmpC‐producing indicator E. coli can be calculated based on the data collected during 2015 only (fattening pigs and calves), and since data for calves is available for a limited number of countries, this graph shows the correlation between the two indicators (fully susceptible indicator E. coli vs ESBL‐/AmpC‐producing indicator E. coli) calculated only for fattening pigs. This allows investigating better the correlation between the two indicators.
