
Figure F.8.
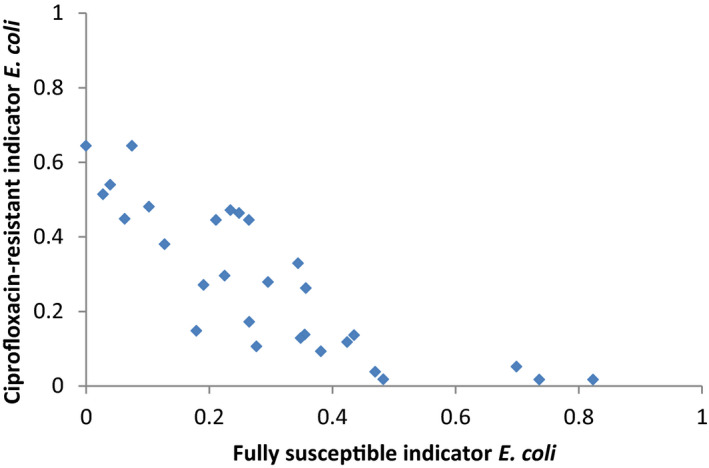
Correlation between possible indicators for AMR in food‐producing animals: selected indicator ‘fully susceptible indicator E. coli’ vs selected indicator ‘ciprofloxacin‐resistant indicator E. coli’
Official websites use .gov
A
.gov website belongs to an official
government organization in the United States.
Secure .gov websites use HTTPS
A lock (
) or https:// means you've safely
connected to the .gov website. Share sensitive
information only on official, secure websites.
Correlation between possible indicators for AMR in food‐producing animals: selected indicator ‘fully susceptible indicator E. coli’ vs selected indicator ‘ciprofloxacin‐resistant indicator E. coli’