
Figure 17.
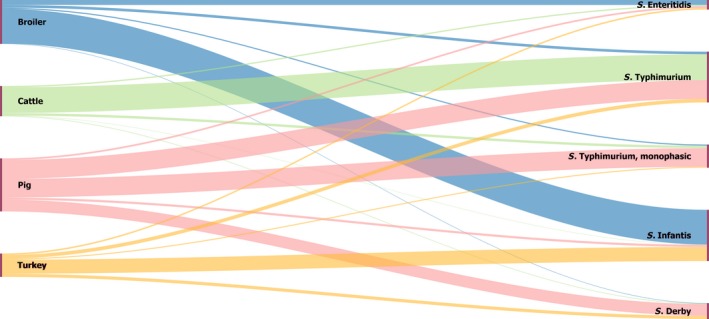
Sankey diagram of the distribution of the EU top‐five Salmonella serovars in human salmonellosis acquired in the EU, across different food, animal and meat sectors (broiler, cattle, pig and turkey), by source, EU, 2016
- The left side of the diagram shows the five most commonly reported serovars from EU domestic cases of human infection: S. Infants (blue), S. Typhimurium (green), S. Enteritidis (pink), monophasic S. Typhimurium (yellow) and S. Derby (violet). Animal and food data from the same source were merged: broiler includes isolates from broilers and broiler meat, cattle includes isolates from bovine animals and bovine meat, pig includes isolates from pigs and pig meat, turkey includes isolates from turkeys and turkey meat. The right side shows the four sources considered (broiler, cattle, pig and turkey). The width of the coloured bands linking sources and serovars is proportional to the percentage of isolation of each serovar in each source.