
Figure 27.
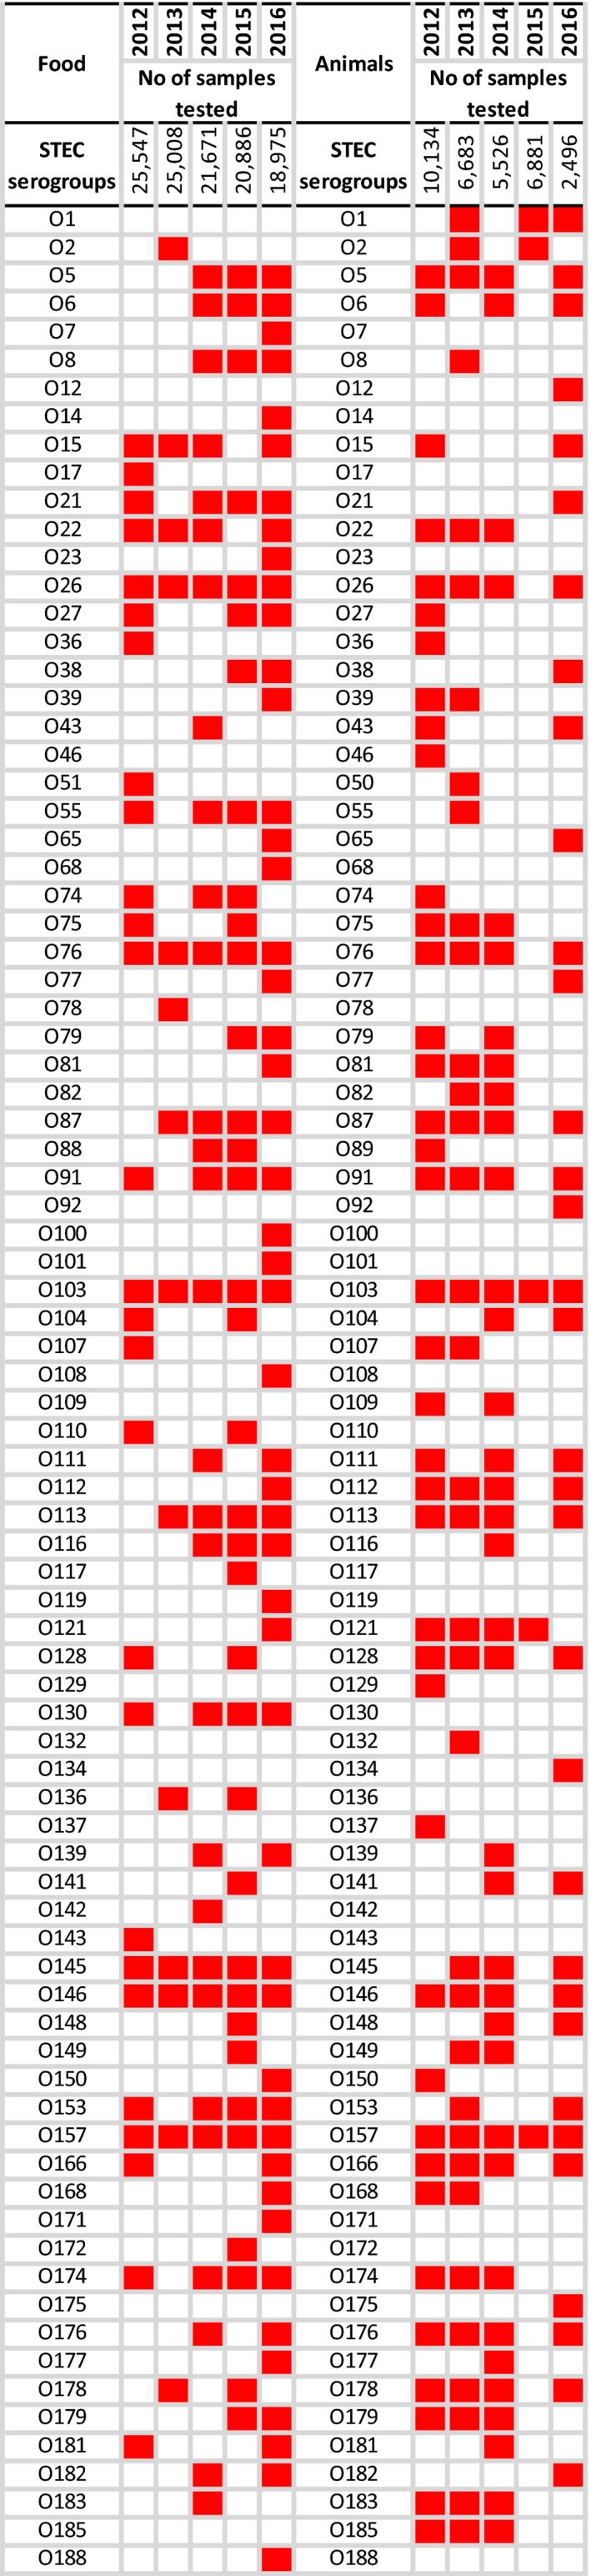
Frequency distributions of reported STEC serogroups in food and animals, Member States and non‐Member States, during 2012 and 2016
- Note: Presence (red boxes) and absence of STEC serogroups in foods (left) and animals (right). STEC: Shiga toxin‐producing Escherichia coli.