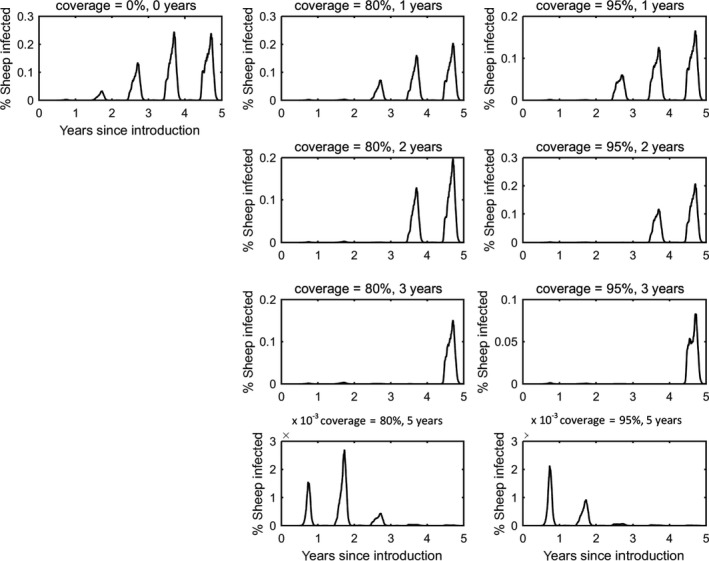
Figure 6.

Prevalence of infected sheep in simulated epidemics of bluetongue in Great Britain and the impact of vaccination
- The vaccination strategy simulated is indicated in the title for each panel (farm‐level coverage and number of years for which vaccine is used). Each plot shows the mean prevalence (%) based on 100 replicates of the model.
