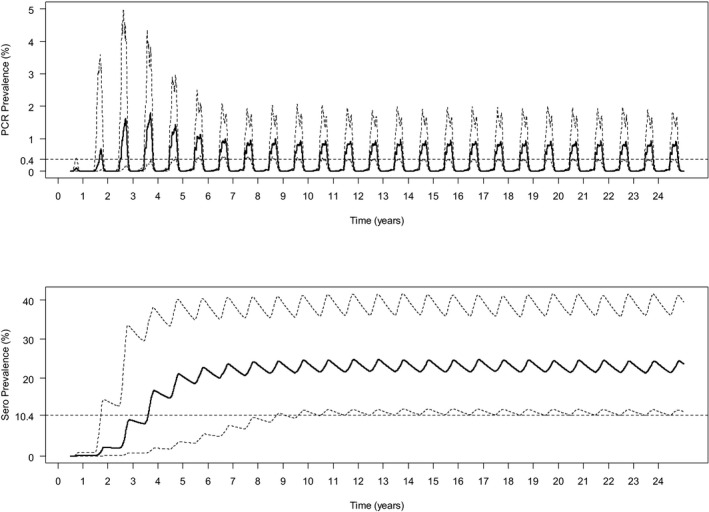
Figure 9.

Serological and infection prevalence in cattle and small ruminants after a certain number of years from the infection and without the application of any control measure
- The bold line is the median, the dot lines are the 97.5th and the 2.5th percentiles. The latter can be considered as the lowest possible level of both infection and serological prevalence on the long term.
