
Figure 14.
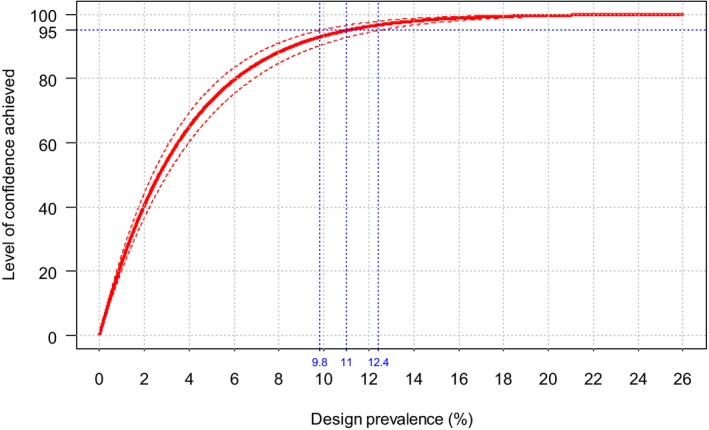
Best‐case scenario for detectable prevalence given the sample survey at NUTS3 level (the French department)
- The bold line is the median, the dot lines are the 2.5th and 97.5th percentiles, the related values of design prevalence are indicated.