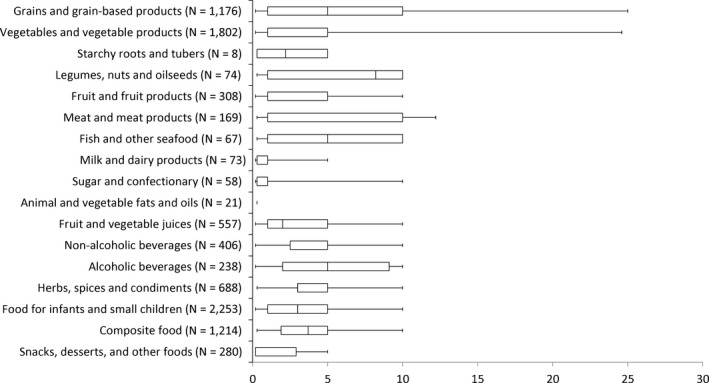
Figure 10.

Distribution of reported limits of quantification in μg/kg, presented by food group
- Vertical line represent the median value, box outline represent 25th and 75th percentiles and whiskers represent 5th and 95th percentiles.

Distribution of reported limits of quantification in μg/kg, presented by food group