
Figure F.1.
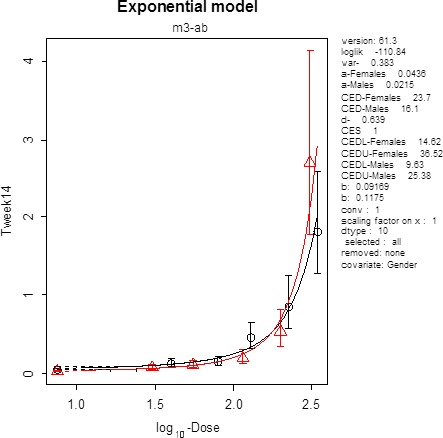
Plot of the selected model for males (triangles) and females (circles) y axis is the effect size and x axis is the dose of nitrite
Official websites use .gov
A
.gov website belongs to an official
government organization in the United States.
Secure .gov websites use HTTPS
A lock (
) or https:// means you've safely
connected to the .gov website. Share sensitive
information only on official, secure websites.
Plot of the selected model for males (triangles) and females (circles) y axis is the effect size and x axis is the dose of nitrite