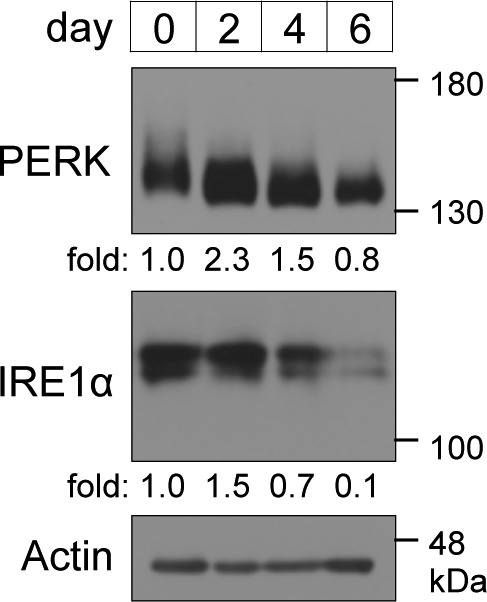
Figure S2. Expression levels of ER-resident stress sensors during brown adipocyte differentiation.

Cells were lysed on the indicated days and analysed by immunoblotting with the indicated antibodies. The amount of PERK and inositol-requiring enzyme 1α were calculated, and the ratio of PERK or inositol-requiring enzyme 1α to actin on each day is shown as the fold change relative to that on day 0. Actin was used as a loading control.
