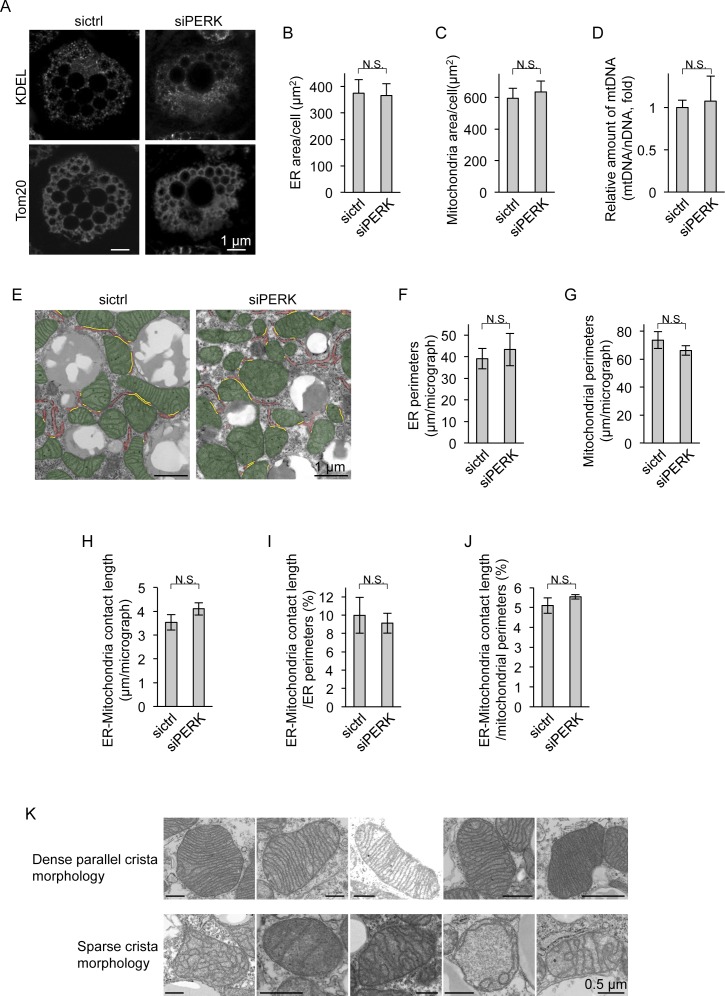
Figure S3. Morphological analysis of the ER and mitochondria in PERK-deficient brown adipocytes (BAs).
(A) Immunocytochemical images of mitochondria and the ER in BAs. siRNA-transfected cells were immunostained with anti-Tom20 and anti-KDEL antibodies. (B, C) Areas of the ER and mitochondria in BAs. (B, C) The ER area (B) and mitochondrial area (C) per cell were measured from immunocytochemical images (A) using ImageJ software (sictrl, total of 11 individual cells; siPERK, total of 18 individual cells from three independent experiments). (D) Amount of mitochondrial DNA (mtDNA) in BAs. Total DNA was isolated from siRNA-transfected cells on day 6. The nuclear DNA and mtDNA levels were measured by qPCR, and the ratio of mtDNA to nuclear DNA is shown as the fold change relative to the value in sictrl-transfected BAs (n = 3 independent experiments). (E, F, G, H, I, J) Quantification of ER–mitochondria contact length. sictrl- or siPERK-transfected BAs were fixed on day 6 and analysed by electron microscopy (E), and total length of ER perimeter, mitochondrial perimeter, or contact site in one electron micrograph (EM) were calculated with ImageJ software (F, G, H). Mitochondria and the ER are false-coloured in green and red, respectively. The yellow lines denote ER–mitochondria contact site. (F, G, H) Data are shown as the average from 25 (sictrl) or 24 (siPERK) EMs (F, G, H, n = 3 independent experiments). (I, J) ER–mitochondria contact length was normalized to the ER (I) or mitochondrial (J) perimeter and shown as percentage (n = 3 independent experiments). (K) Representative EMs of dense parallel cristae or sparse cristae of mitochondria in differentiated BAs. Data information: data are presented as mean ± SEM. NS (t test).

