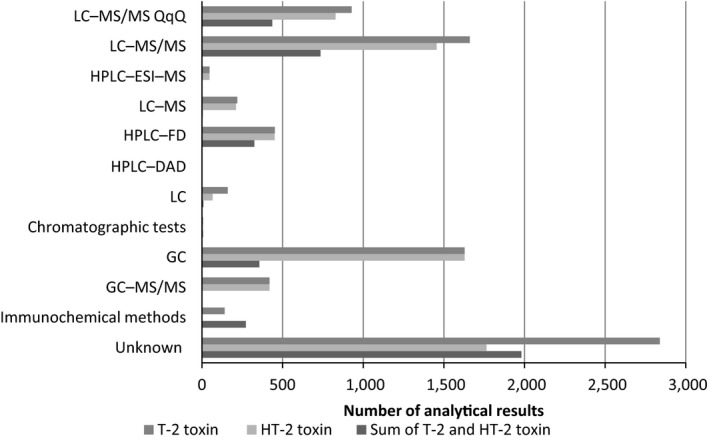
Figure 4.

- LC: liquid chromatography; MS/MS: tandem mass spectrometry; QqR: triple quadrupole; HPLC: high‐performance liquid chromatography; ESI: electrospray (ionisation); FD: fluorescence detection; DAD: diode array detection; GC: gas chromatography.
