
Figure 2.
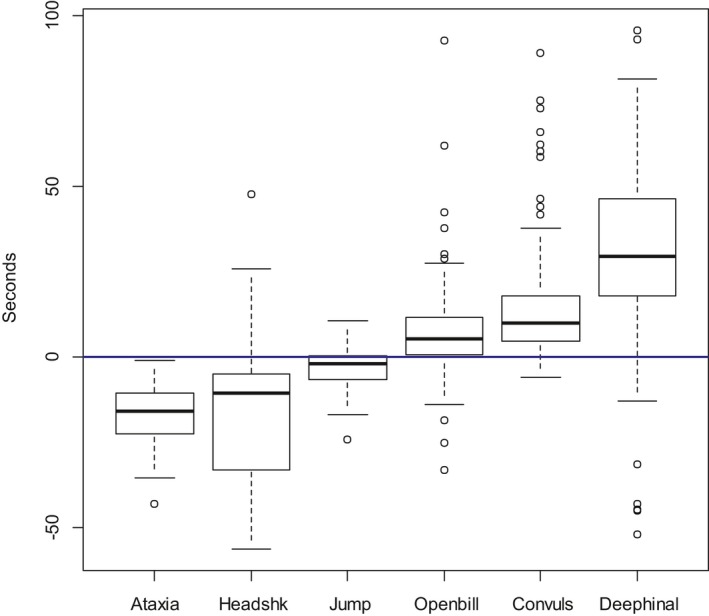
The boxplots describe the difference in time (seconds) between the onset of each behaviour against the loss of posture (LOP, blue line) calculated for each bird from Papers 6, 7 and 8. Below the blue line = before the LOP; above the blue line = after the LOP