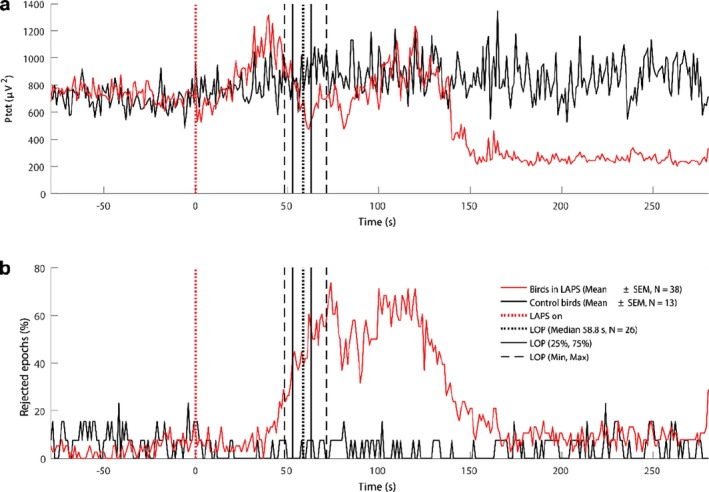
Figure 4.

Dynamics of total EEG power (Ptot, a) and percentage of rejected epochs (b) in birds undergoing LAPS (red line) and in control birds (black line). Ptot represents power of the signal in the frequency range (1–200) Hz. LAPS onset is marked by vertical red dotted line at time zero. Loss of posture (LOP) is marked by vertical black lines (median (dotted), quartiles (solid) and range (dashed)). Percentage of rejected epochs is an indirect measure of birds’ motor activity (including clonic convulsions). Note that an onset of an increase of motor activity at around 50 s coincides with animal arousal manifested by a drop in total EEG power (see also Figure 4a)
