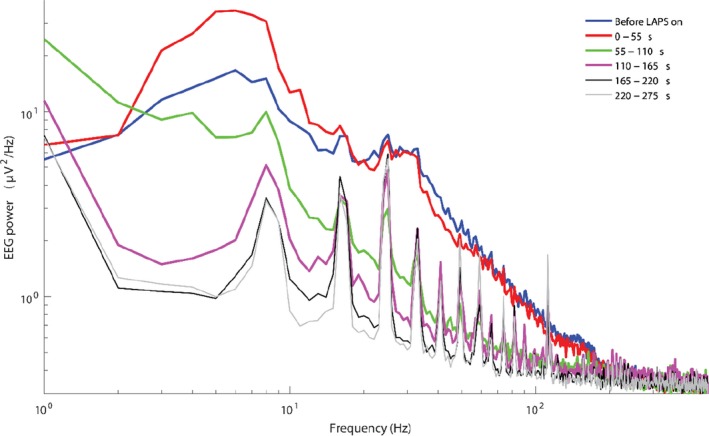
Figure 5.

EEG power spectrum (median) in birds (n = 38) during LAPS. The BLUE line describes the pre‐stun EEG power spectrum. The other lines represent temporal dynamics of EEG spectrum during five sequential 55‐s intervals in LAPS. Regular peaks in the power spectrum at the end of LAPS procedure are technical artefacts. During beginning of LAPS they are masked by high‐amplitude EEG
