
Figure 9.
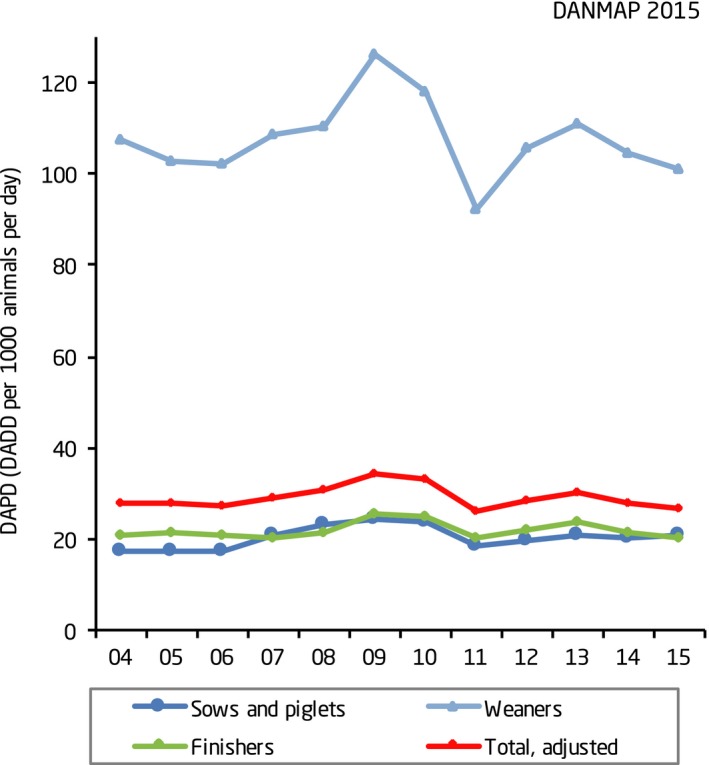
Antimicrobial consumption in the pig production, and the distribution on age groups, Denmark (source: (DANMAP, 2016) – see also original report)
Official websites use .gov
A
.gov website belongs to an official
government organization in the United States.
Secure .gov websites use HTTPS
A lock (
) or https:// means you've safely
connected to the .gov website. Share sensitive
information only on official, secure websites.
Antimicrobial consumption in the pig production, and the distribution on age groups, Denmark (source: (DANMAP, 2016) – see also original report)