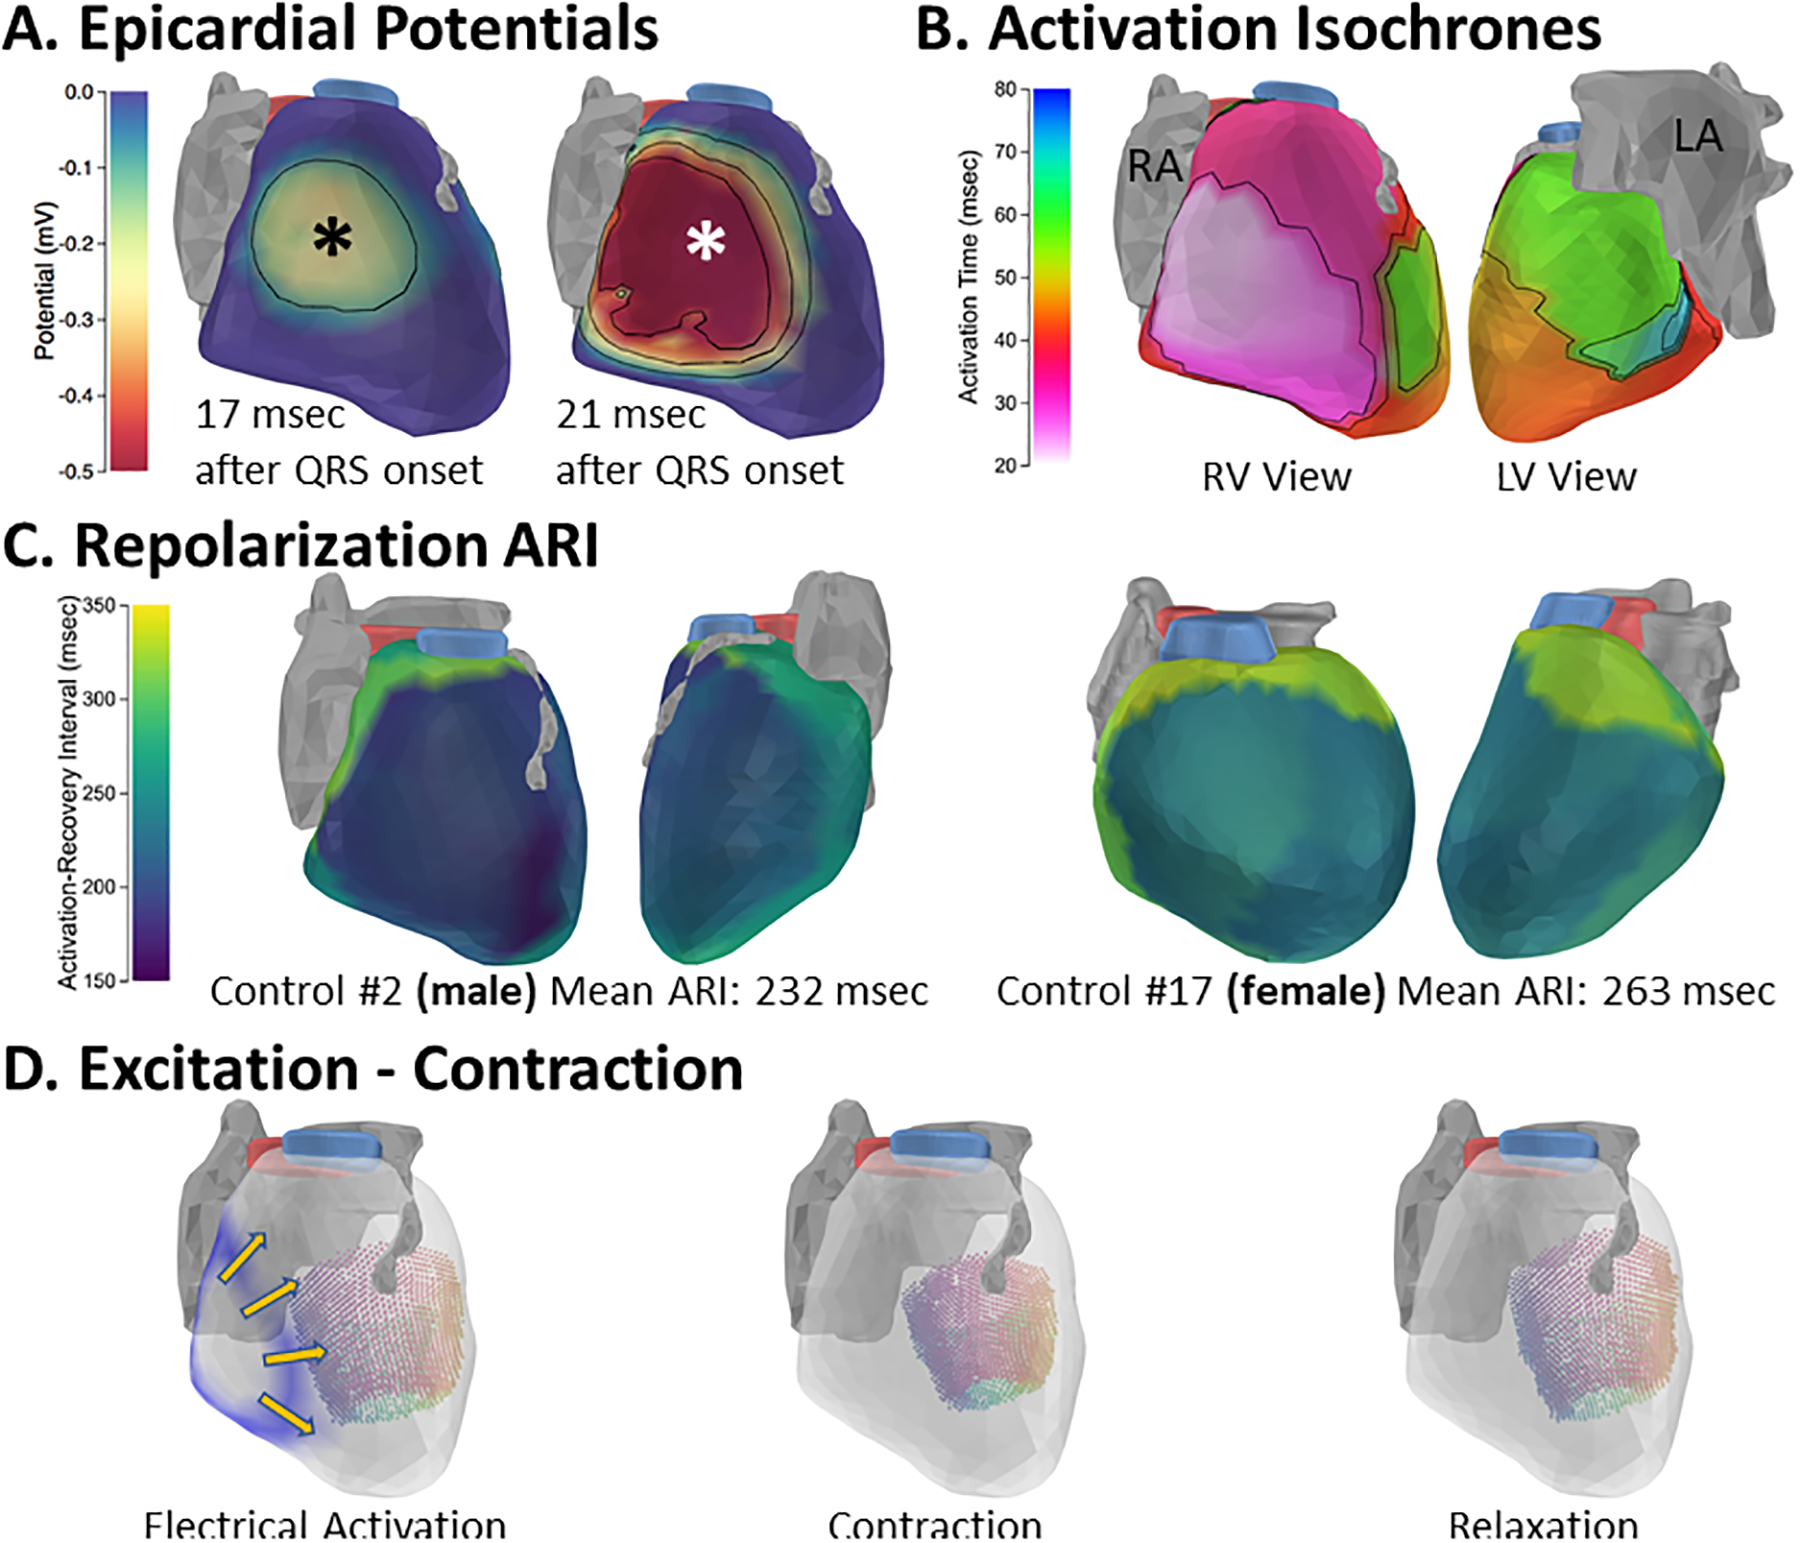
Figure 1.

Excitation and contraction of the healthy adult human heart. A. Epicardial breakthrough. A potential minimum, indicating epicardial breakthrough, appears and expands in the mid lateral RV shortly after the QRS onset; the breakthrough center is indicated by asterisk. RV outflow tract is shown in blue and LV outflow tract in pink. Atria and LAD shown in gray. B. Electrical activation isochrones in the same subject. C. Activation-recovery interval maps from a representative male (left) and female (right) demonstrate the longer repolarization in females compared to males. D. Electromechanical sequences in a healthy adult heart. Electrical activation wave is shown in blue, with direction of propagation indicated by yellow arrows (left image). LV displacements during contraction of the same heart are depicted by colored points, with colors indicating wall segments. Point colors vary from septal (purple) to lateral (yellow). An animation of the electro-mechanical sequence is provided in the Supplemental Movie.
RA: right atrium; LA: left atrium. LAD: left anterior descending coronary artery
