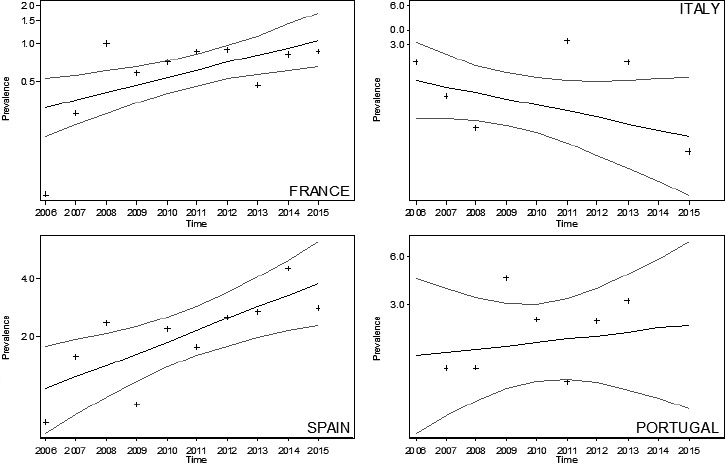
Figure 6.

Temporal trends of AS in goats in ES, FR, IT and PT, during the period 2002–2015
- Crosses (+) indicate the annual stream‐adjusted prevalence (cases per 10,000 rapid tests). Lines show the linear trend (black line) and the bounds of the 95% CI (grey lines).
