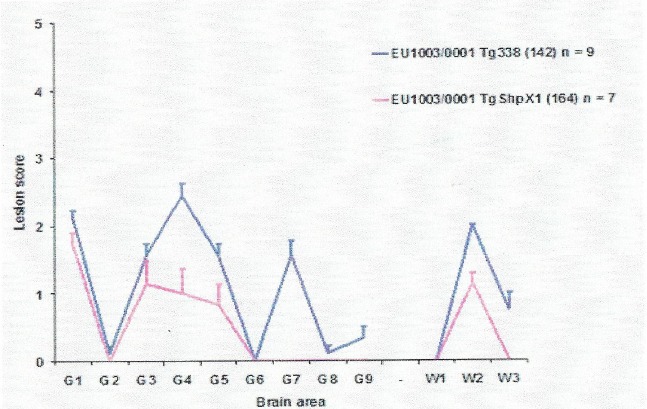
Figure E.2.

Lesion profiles from Tg338 and tgShpXl mice challenged with the homogenate that was used to challenge the goats
- Only clinically positive mice contributed to the lesion profiles. Ten mice of each mouse line were challenged. Numbers in brackets indicate the average IP of the mice which contributed to the profile. n = number of mice which contributed to the profile.
