
Figure B.1.
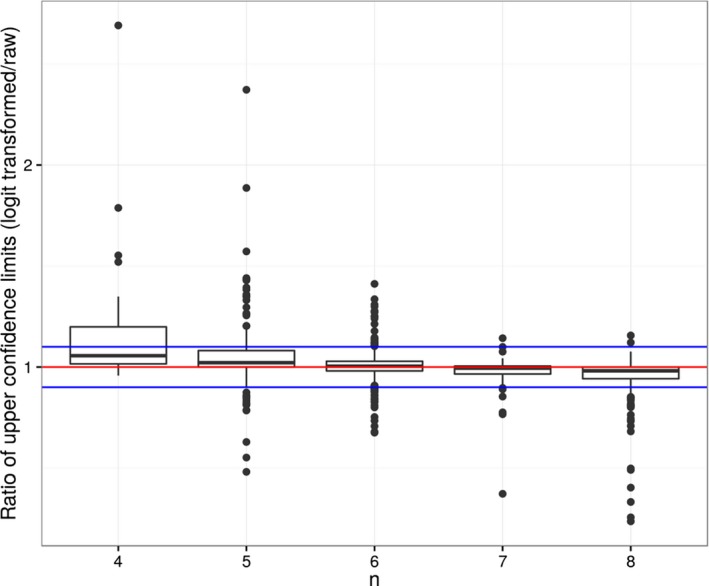
Box plots, by sample size n, of the ratio of logit‐transform based upper confidence limit to raw data upper confidence limit. Red line highlights where the limits are equal and blue lines where the ratio is between 0.9 and 1.1
Official websites use .gov
A
.gov website belongs to an official
government organization in the United States.
Secure .gov websites use HTTPS
A lock (
) or https:// means you've safely
connected to the .gov website. Share sensitive
information only on official, secure websites.
Box plots, by sample size n, of the ratio of logit‐transform based upper confidence limit to raw data upper confidence limit. Red line highlights where the limits are equal and blue lines where the ratio is between 0.9 and 1.1