
Figure B.7.
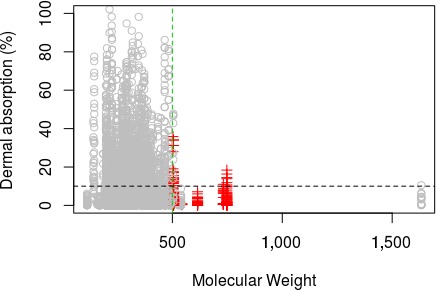
Scatter plot of dermal absorption vs molecular weight. Vertical green line depicts cut off at MW > 500. Horizontal black line depicts the 10% value. Red crosses denote records for which log Pow < −1 or > 4 and MW > 500
Official websites use .gov
A
.gov website belongs to an official
government organization in the United States.
Secure .gov websites use HTTPS
A lock (
) or https:// means you've safely
connected to the .gov website. Share sensitive
information only on official, secure websites.
Scatter plot of dermal absorption vs molecular weight. Vertical green line depicts cut off at MW > 500. Horizontal black line depicts the 10% value. Red crosses denote records for which log Pow < −1 or > 4 and MW > 500