
Figure B.3.
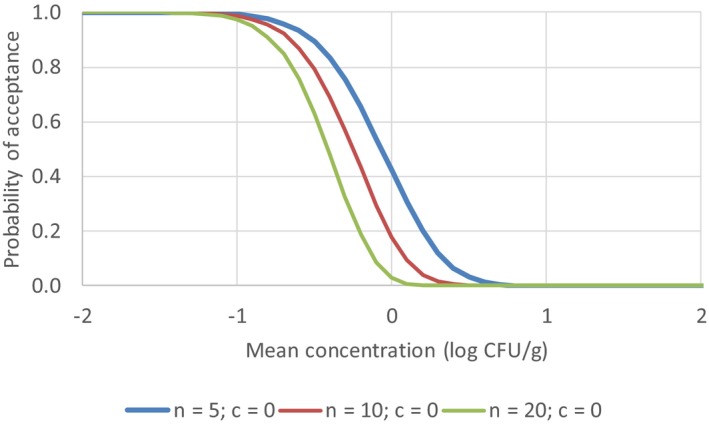
OC curve showing the performance of different two‐class attributes sampling plans based on a microbial log‐normal distribution with mean = 2 log CFU/g and standard deviation = 0.5 log CFU/g
Official websites use .gov
A
.gov website belongs to an official
government organization in the United States.
Secure .gov websites use HTTPS
A lock (
) or https:// means you've safely
connected to the .gov website. Share sensitive
information only on official, secure websites.
OC curve showing the performance of different two‐class attributes sampling plans based on a microbial log‐normal distribution with mean = 2 log CFU/g and standard deviation = 0.5 log CFU/g