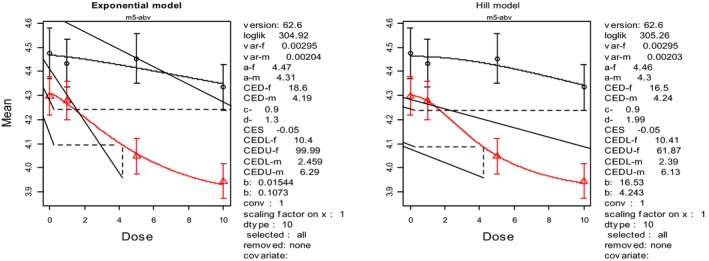
Figure G.4.

Concentration–response curves for feed intake of female and male mice combined (see also Table G.5)
- Mean feed intake is expressed as g feed per day and concentration as mg/kg feed per day. The red (upper) curve is for male and the black (lower) for female mice data.
