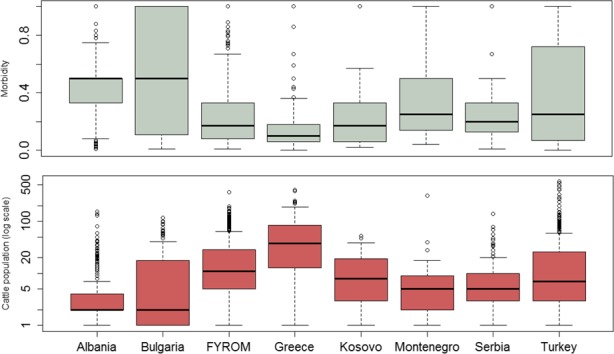
Figure 7.

Distribution of intraherd morbidity (above) and of total exposed susceptible cattle population (below) in the affected farms
- Boxes are defined by lower, median and upper quartile, whiskers indicate 1.5 interquartile range

Distribution of intraherd morbidity (above) and of total exposed susceptible cattle population (below) in the affected farms