
Figure 7.
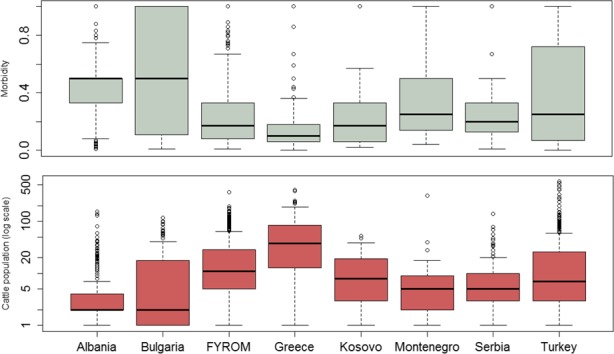
Distribution of intraherd morbidity (above) and of total exposed susceptible cattle population (below) in the affected farms
- Boxes are defined by lower, median and upper quartile, whiskers indicate 1.5 interquartile range
Official websites use .gov
A
.gov website belongs to an official
government organization in the United States.
Secure .gov websites use HTTPS
A lock (
) or https:// means you've safely
connected to the .gov website. Share sensitive
information only on official, secure websites.
Distribution of intraherd morbidity (above) and of total exposed susceptible cattle population (below) in the affected farms