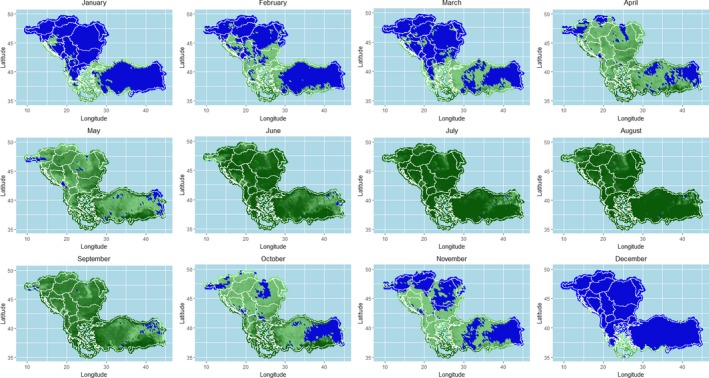
Figure 26.

Opportunity map for vector survival in south‐eastern Europe considering minimum temperature above 10°C
- Blue zones represent the areas where vector survival is hampered; green zones indicate number of days in the month in which conditions are favourable. Darker colours indicate longer periods with favourable conditions.
