
Figure 10.
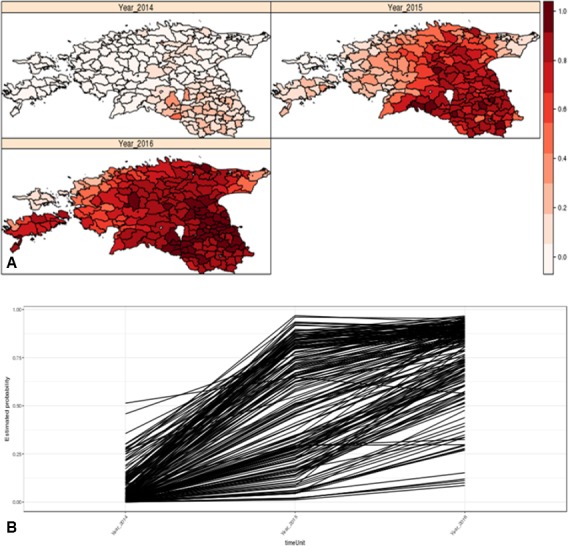
Modelling outputs, fitted values for each region and timepoint. Mean estimated probability for the temporal profiles for each LAU2 region (time evolution of the estimated probability of observing ASF cases for each LAU2 region, B) and their estimated spatial pattern for each year (yearly map of the estimated probability of observing ASF cases in each region, A)