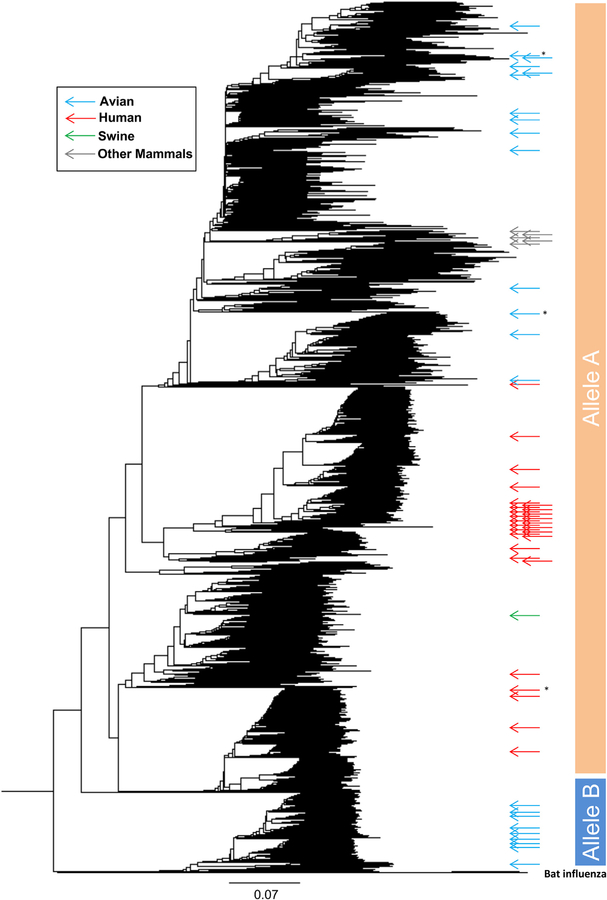
Figure 1. Phylogenetic and Spatio-temporal Diversity of the NS1-Barcoded Viral Library.
Phylogenetic tree containing all available NS1 sequences, assembled by following the neighbor joining (NJ) method and using p distances. Selected NS1 sequences used in this study are depicted as colored arrows along the tree based on their host origin: human (red), avian (blue), swine (green), and other mammals (gray). The distance bar is shown below the tree. Strains are depicted as shown in Table S1. Asterisks denote isolates that were involved in cross-species transmissions following this order: Vietnam/1203/2004 (H5N1) and A/Shanghai/02/2013 (H7N9) viruses were included as avian origin (blue arrows), because they came from a zoonotic transmission from an avian host. Similarly, A/Elephant seal/California/2010 is red (human), because it was a reverse zoonotic transmission from humans.

