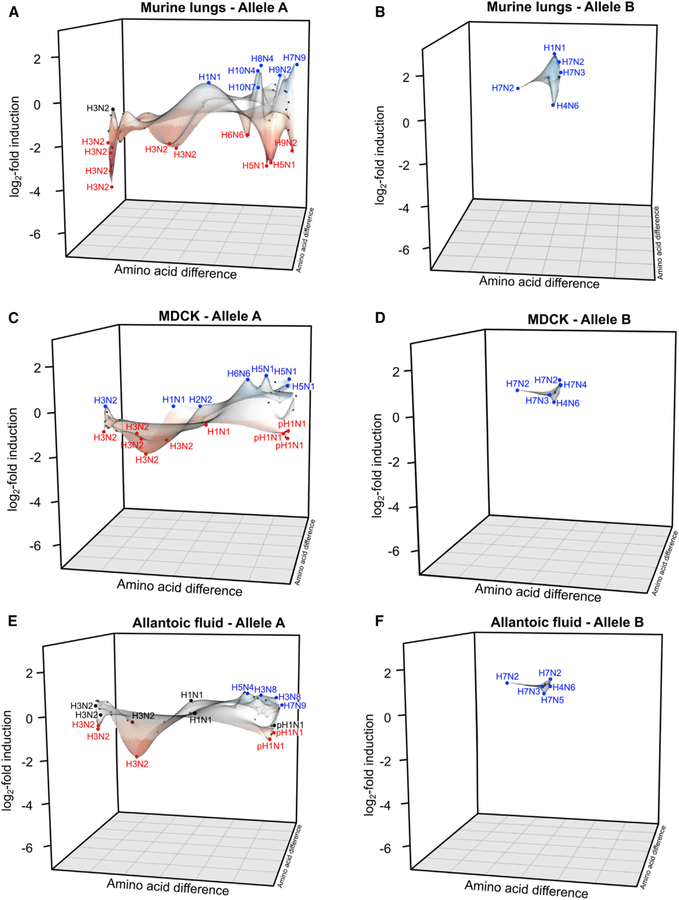
Figure 4. NS1 Evolutionary Directions within the Viral Library Show Species-Dependent Profiles that Preferentially Overrepresent Specific NS1 Clades.
Amino acid differences across all NS1 sequences were integrated in a percentage identity matrix, and relative distances were plotted using x and y coordinates. Averages of triplicates expressed as the log2 fold induction over the initial relative proportion of barcode reads found in the initial viral mix (input) were plotted on the z axis. (A–F) Individual plots in mice (A and B), MDCK cells (C and D), and allantoic fluid (E and F) were generated. Viruses containing allele A (A, C, E) or allele B (B, D, F) NS1 were plotted separately in each case for visualization purposes.

