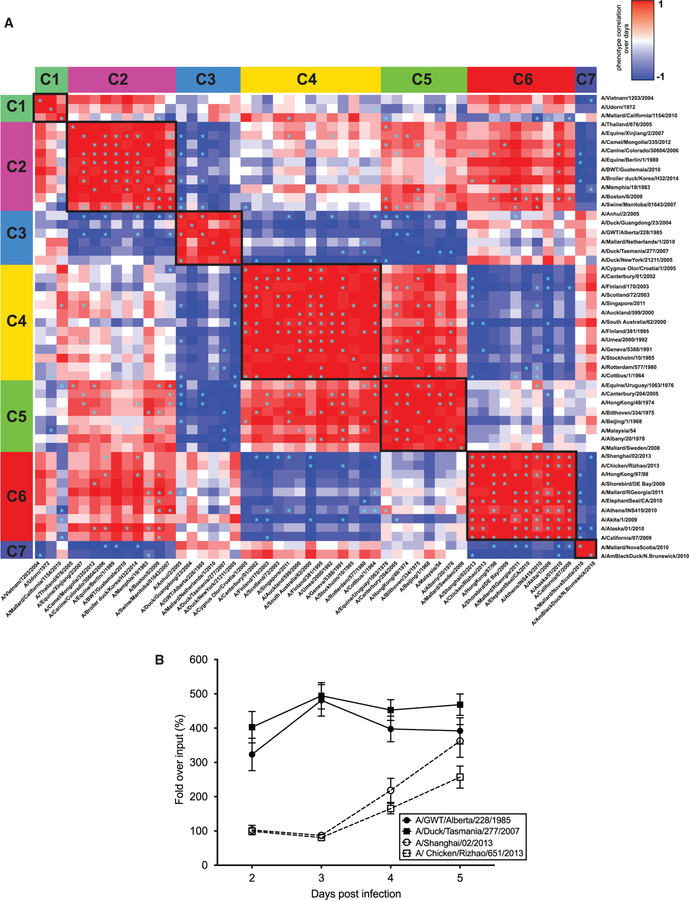
Figure 6. Time Course Analysis Revealed Correlating Clusters of Phylogenetically Related Viruses with Similar Trends In Vivo.
(A) WT mice were infected with the NS1 viral library, and barcode read profiles for each virus were analyzed at days 2–5 post-infection. Fitness trends over time were clustered by similarity. *p < 0.05.
(B) Representative viruses exhibiting the highest barcode abundance followed different dynamics over time and can be mainly divided into two groups. For instance, allele B NS1 recombinant viruses showed high levels since early after infection (continuous lines), while others, such as A/Shanghai/02/2013 (H7N9) and its phylogenetically closest related A/Chicken/Rizhao/651/2013 (H9N2), gradually increased over time. Error bars depict SD of at least 6 replicates.

