Figure 3.
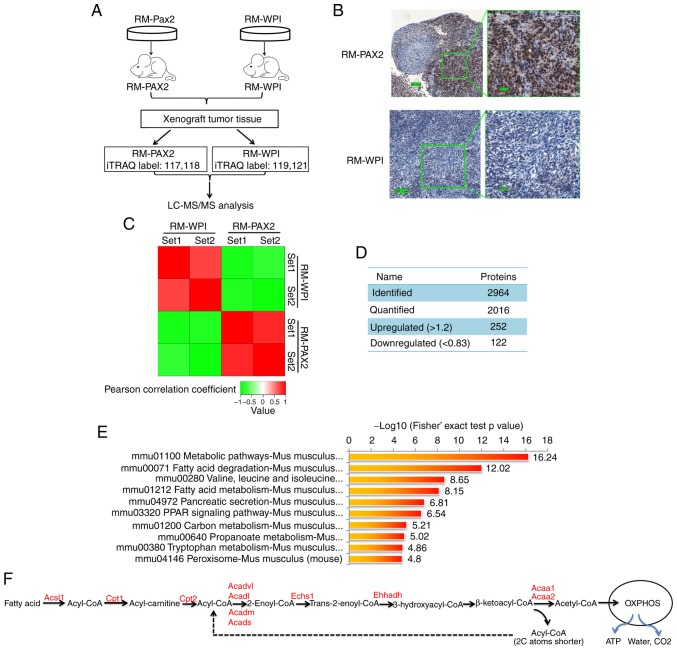
iTRAQ proteomics profiling of RM tumors overexpressing PAX2. (A) An overview of the workflow employed in this study. Two iTRAQ replicates were carried out to ensure the consistency and reliability of the results. (B) Expression of PAX2 in allograft RM tumors was confirmed by immunohisto-chemistry. (C) Reproducibility analysis of 2 repeated trials by Pearson's correlation coefficient. (D) Summary of identified and quantified proteins. (E) KEGG pathway-based enrichment analysis of up-regulated proteins (RM-PAX2 vs. RM-WPI). (F) Fatty acid metabolism. Enzymes upregulated by PAX2 overex-pression are indicated in red color. PAX2, paired box 2; Acsl, long-chain-fatty-acid-CoA ligase 1; Cpt1, carnitine O-palmitoyltransferase 1; Cpt2, Carnitine O-palmitoyltransferase 2; Acadl, long-chain specific acyl-CoA dehydrogenase, mitochondrial; Acadvl, very long-chain specific acyl-CoA dehydrogenase, mitochondrial; Acads, short-chain specific acyl-CoA dehydrogenase, mitochondria; Acadm, medium-chain specific acyl-CoA dehydrogenase, mitochondrial; Echs1, Enoyl-CoA hydratase; Ehhadh, peroxisomal bifunctional enzyme; Acaa1, 3-ketoacyl-CoA thiolase A; Acaa2, 3-ketoacyl-CoA thiolase, mitochondrial.

