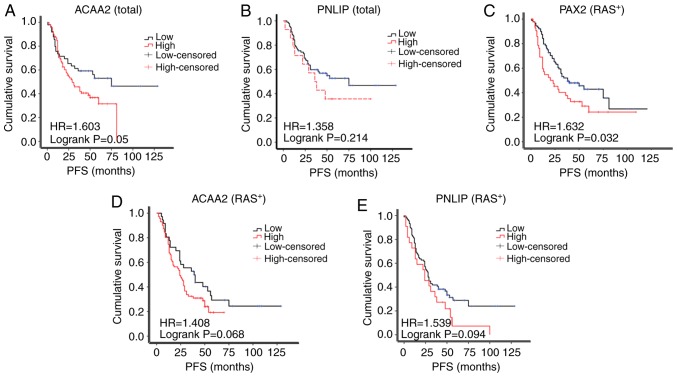
Figure 5.
ACAA2 overexpression is associated with a poor prognosis of patients with ovarian cancer. (A and B) Kaplan-Meier progression-free survival curves for patients with a low or high expression of (A) ACAA2 or (B) PNLIP among the total number of patients; (C-E) Kaplan-Meier progression-free survival curves for patients with (C) a negative PAX2 expression (PAX2−) or positive PAX2 expression (PAX2+), (D) low or high ACAA2 expression or (E) low or high PNLIP in expression RAS positive (RAS+) subgroup.

