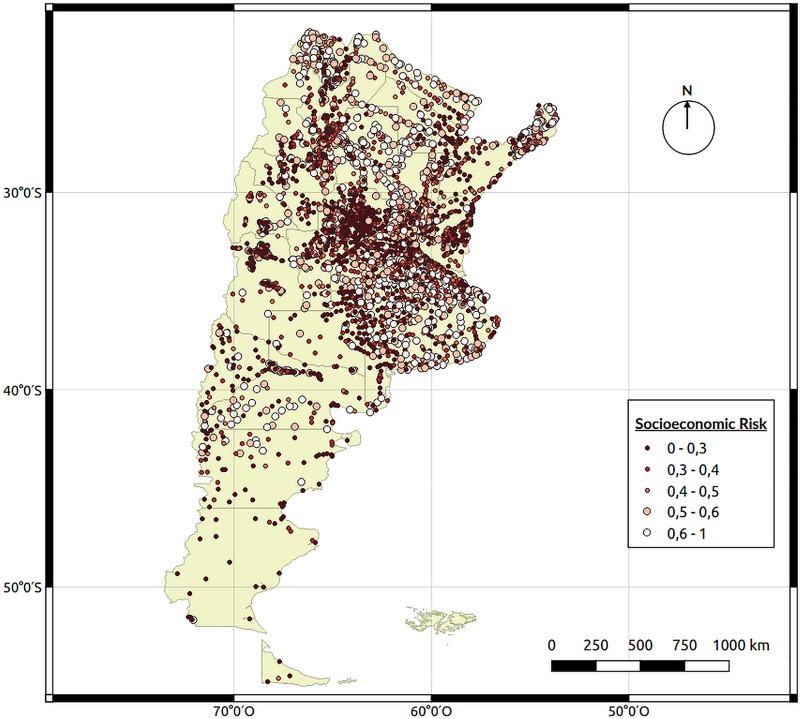
Fig 3. Socioeconomic (SEC) risk map.
Each point on the map represents a georeferenced city with the average socioeconomic data obtained from the last national census performed in 2010. Map created using QGIS Geographic Information System. Open Source Geospatial Foundation Project. http://qgis.osgeo.org.

