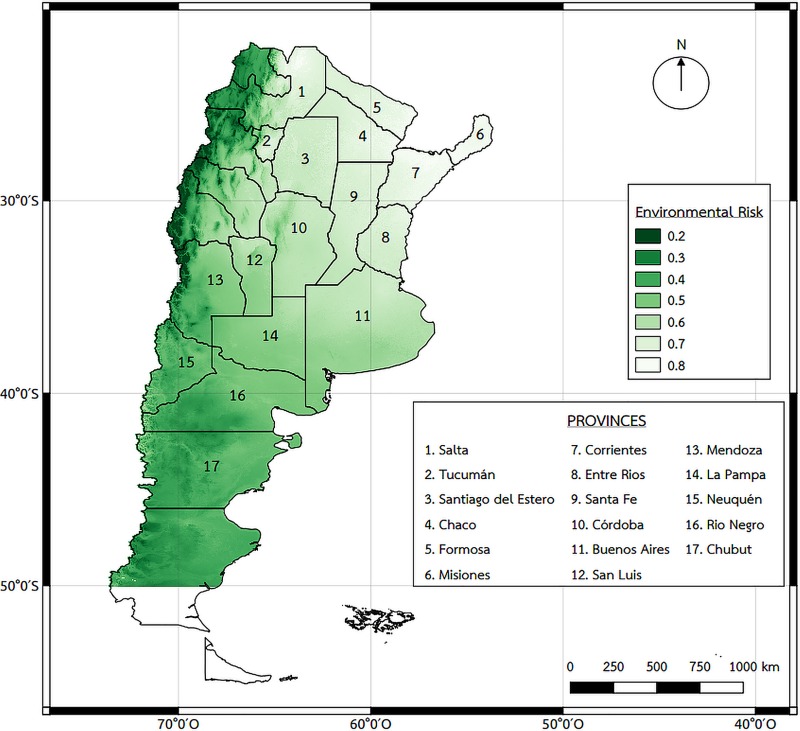
Fig 4. Environmental characteristics (EC) risk map.
This data was obtained using different sources such as WorldClim which is available until -50°S latitude, MODIS TERRA NDVI products obtained for a ten-year period (2004 to 2014), the mean of the warmest month calculated through a general vegetation approach (January NDVI mean), the SERENA project for land cover type data and altitude was obtained from the Space Shuttle Radar Topography Mission. Map created using QGIS Geographic Information System. Open Source Geospatial Foundation Project. http://qgis.osgeo.org.

