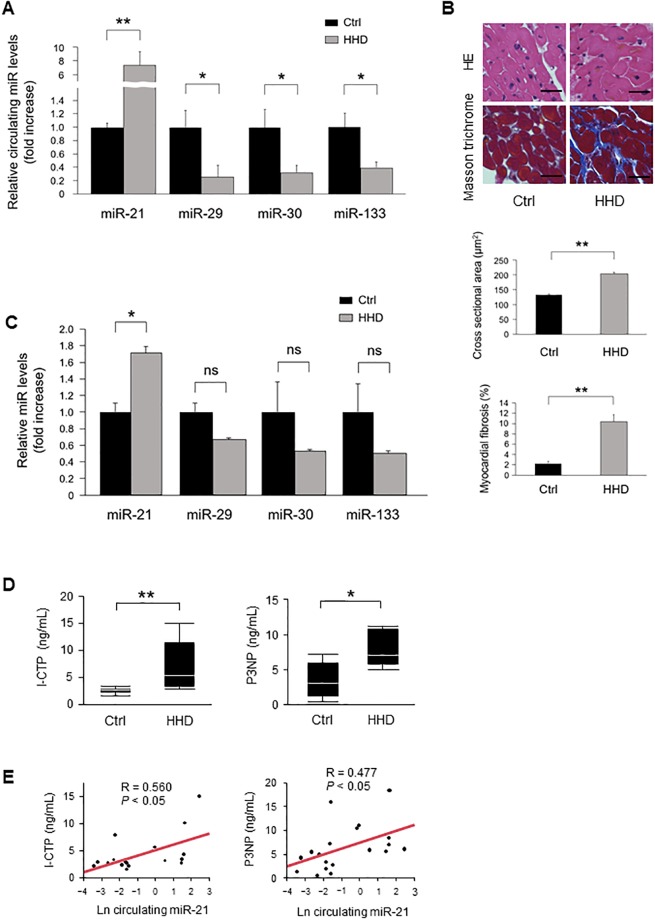
Fig 1. Association between miRs expressions and cardiac remodeling in patients with HHD.
(A) Circulating miRs expressions in patients with HHD (n = 10 per group). (B) Representative images and analysis of cardiac remodeling by HE and Masson’s trichrome staining in heart samples from HHD patients and normal subjects (n = 3 per group). Scale bars = 20 μm. (C) Expression of miRs levels in heart samples from patients with HHD (n = 3 per group). (D) Serum I-CTP and P3NP levels in patients with HHD. (E) Circulating miR-21 levels were positively correlated with serum I-CTP and P3NP levels in patients with HHD. Data are expressed as mean ± SEM. *P < 0.05, **P < 0.01.

